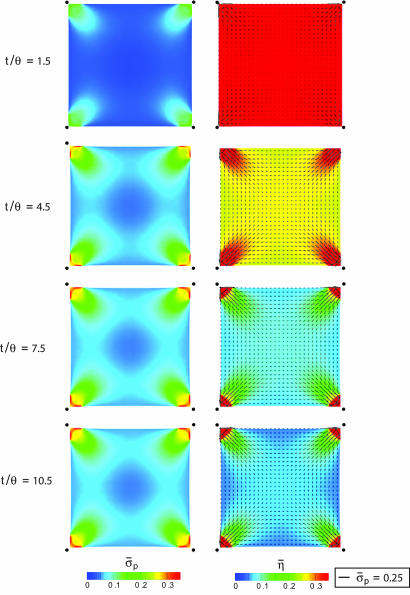
Fig. 4.
The distribution of the normalized maximum principal stress σ̄p and average stress fiber activation level η̄ at four selected times (support stiffness k̄E = 10). The distributions of the orientations φp also are included as line segments (with length scaled by the magnitude of the normalized stress σ̄p). The filled circles show the original positions of the cell corners.

