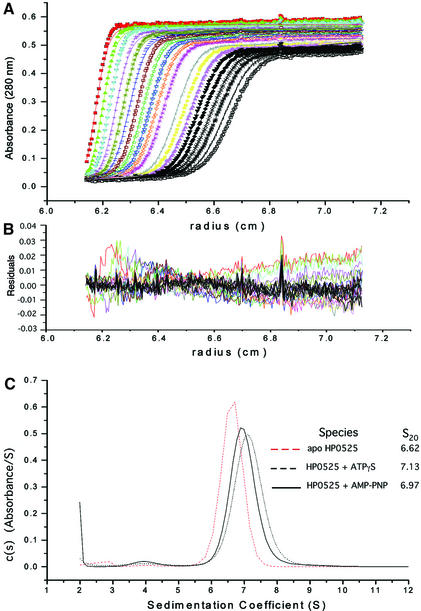
Fig. 3. Sedimentation coefficient distribution analysis of apo-, ATPγS-bound and AMP-PNP-bound HP0525. (A) Sedimentation velocity data of 5 µM HP0525 centrifuged at 40 000 r.p.m. Lines represent linear fits of the continuous c(s) conformational change model when constraining the molecular mass to 225 kDa, as a model for the sedimentation coefficient distribution of hexameric HP0525. Different colors are used to distinguish between successive data collection times. (B) Residuals from the linear fits described in (A). (C) Sedimentation coefficient distributions c(s) from the conformational change model.

An official website of the United States government
Here's how you know
Official websites use .gov
A
.gov website belongs to an official
government organization in the United States.
Secure .gov websites use HTTPS
A lock (
) or https:// means you've safely
connected to the .gov website. Share sensitive
information only on official, secure websites.
