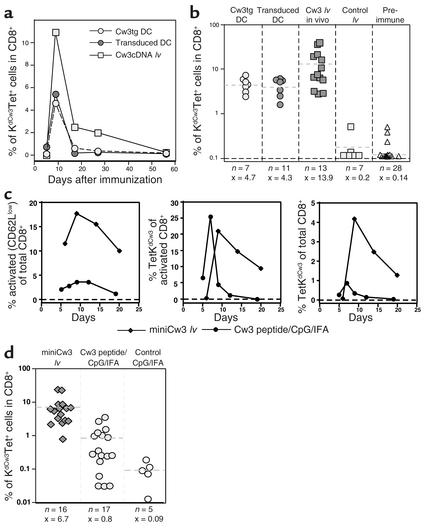
Figure 3.
Comparative analysis of the CD8+ T cell response as induced by lentivector administration, DC-based vaccination, and peptide/CpG/adjuvant vaccination. (a) Comparative vaccination with transgenic DCs, transduced DCs, and direct in vivo administration of lentivector. Mice were vaccinated and PBLs were analyzed by FACS analysis as described. Evolution of the Cw3-specific population over time is shown. All graphs show individual mice that were representative of at least seven mice used for each condition in at least three independent experiments. (b) Proportion of Cw3-specific cells in the CD8+ compartment as determined at peak response with all vaccination conditions plus preimmune levels (dashed lines and x = average, n = number of mice tested). (c) Comparative vaccination with Cw3 minigene lentivector and Cw3 peptide/CpG/IFA vaccination. Shown are time courses of the proportion of activated CD8+ cells and the proportion of Cw3-specific cells within the activated population followed by the proportion of Cw3-specific cells in the CD8+ population. (d) Proportion of Cw3-specific cells in the CD8+ compartment as determined at peak response (day 9 for lentivector vaccination and day 7 for peptide-adjuvant vaccination) of all mice tested (dashed lines and x = average, n = number of mice tested).

