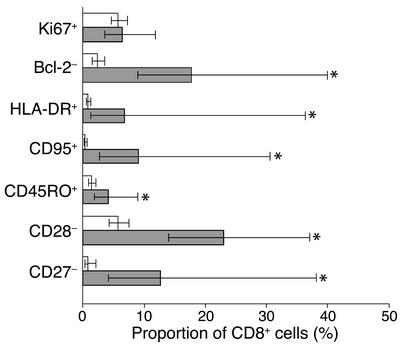
Figure 1.
Phenotype of total CD8+ T cells from control and HCMV-infected newborns. Expression of markers of activation (Ki67, Bcl-2, HLA-DR, CD95) and differentiation (CD45RO, CD28, CD27) by CD8+ T cells of ten controls (white bars) and eight cases (gray bars). Data presented are geometric means and 95% confidence interval. *P < 0.05.

