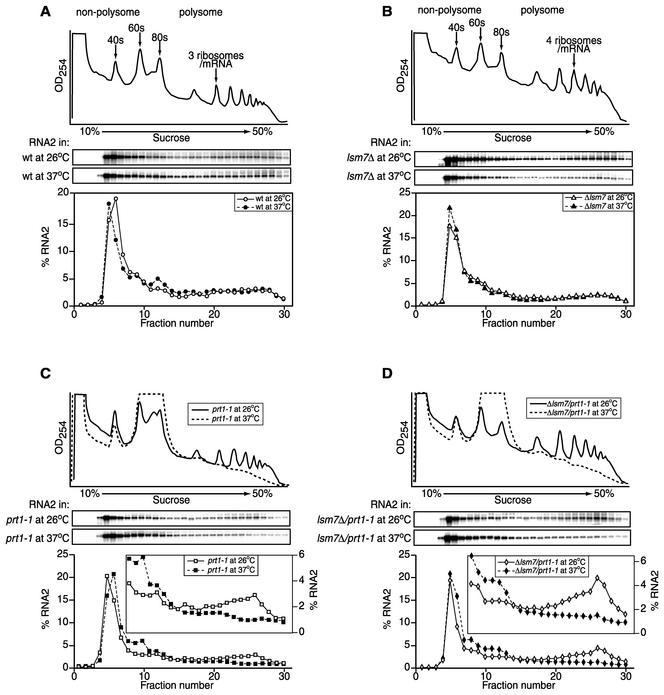
FIG. 9.
Distribution of RNA2 in polysome and nonpolysome fractions in wt (A), lsm7Δ (B), prt1-1 (C), and lsm7Δ/prt1-1 (D) yeast at 26 and 37°C. The traces in the top panels show the UV absorbance profiles at 254 nm of cytoplasmic extracts from the relevant yeast strains expressing wt RNA2 grown at 26°C (solid lines) and grown at 26°C, followed by incubation at 37°C for 30 min (dotted lines), after sedimentation on a 10 to 50% sucrose gradient. Aligned below this are Northern blots of RNA2 in fractions from these gradients, centrifuged in parallel. The bottom curves plot the amount of RNA2 in each fraction, expressed as a percentage of the total amount of RNA2 recovered over the gradient. The insets in lower panels of panels C and D plot samples 8 to 30 on an expanded scale of 0 to 6% total RNA2.

