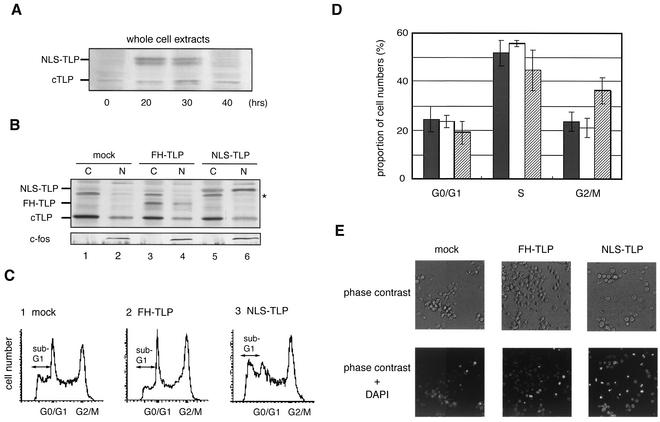
FIG. 4.
NLS-TLP increases the population of cells remaining in the G2 phase and apoptotic cells. (A) Ectopic expression of NLS-TLP proteins was examined by Western blotting. Wild-type cells transfected with the NLS-TLP plasmid were incubated for the indicated times, and amounts of endogenous (cTLP) and exogenous (NLS-TLP) TLP in whole-cell extracts were determined. (B) Nuclear localization of exogenous FH-TLP and NLS-TLP. Twenty hours after transfection, amounts of endogenous TLP (cTLP), c-fos, and exogenous FH-TLP (lanes 3 and 4) and NLS-TLP (lanes 5 and 6) in cytoplasmic (C) and nuclear (N) extracts were determined by Western blotting. Cytoplasmic and nuclear extracts were applied to 1/10 and 3/4 of the total extracts from the same number of cells (approximately 106), respectively. Mock, empty expression vector-transfected cells; FH-TLP and NLS-TLP, wild-type cells transfected with expression plasmids for FH-TLP and NLS-TLP, respectively. An asterisk indicates a nonspecific band. (C) Shift in cell cycle phases elicited by NLS-TLP overexpression. Twenty hours after transfection, the cell cycle profile of each cell batch was analyzed with a FACS. Positions of the sub-G1 region (apoptotic cell population) are indicated. (D) Histogram of results shown in panel C. Solid columns, mock-transfected cells; open columns, cells overexpressing FH-TLP; hatched columns, cells overexpressing NLS-TLP. Averages and standard deviations were calculated from four independent experiments. (E) Detection of apoptotic cells by DAPI staining. At 18 h after transfection, cells were cultured in medium containing DAPI. The microscopic images were taken at an original magnification of ×400.

