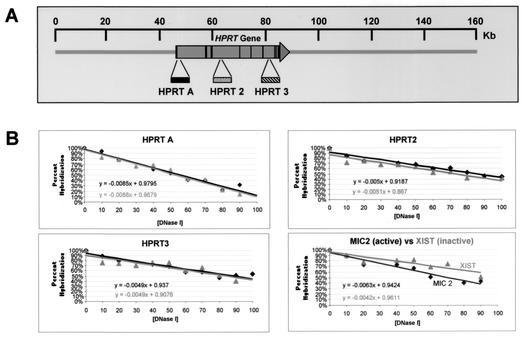
FIG. 6.
Analysis of DNase I general sensitivity of the HPRT locus. (A) Approximate positions of slot blot hybridization probes HPRT A, HPRT2, and HPRT3, relative to the HPRT gene (large horizontal arrow); vertical lines within the arrow indicate exons. The scale at the top is relative to the human X chromosome BAC clone bWXD187 (accession no. AC004383). (B) Quantitation of general DNase I sensitivity assayed by each hybridization probe. Each panel represents analysis of general DNase I sensitivity at a given site in the HPRT gene. Quantitation of probe hybridization to slot blots was performed by PhosphorImager analysis (Materials and Methods). Linear plots were fitted to the data points, and the equation representing each line is shown. Dark lines represent DNase I digestion of HT-1080 chromatin; gray lines represent DNase I digestion of chromatin in cell line Δ3B containing the HPRT promoter mutation. The panel in the lower right corner shows a comparison of general DNase I sensitivities of chromatin from the transcriptionally active MIC2 locus (darker line) and of chromatin from the transcriptionally silenced XIST locus (lighter line) in HT-1080 cells.

