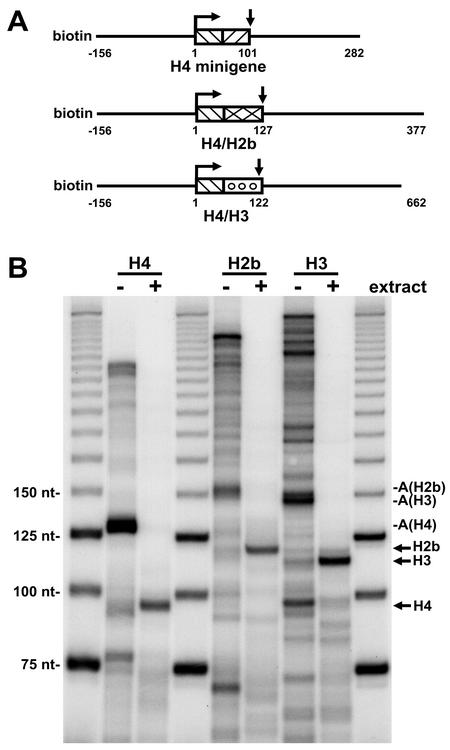
FIG. 7.
Comparison of H4, H2b, and H3 genes. (A) Minigene constructs. The 3′ ends of the H2b and H3 genes were cloned downstream of the H4 promoter to give processed transcripts of the indicated sizes. Templates were generated by PCR by using a biotinylated upstream primer and a downstream primer that resulted in a runoff transcript of the indicated size. (B) Transcription and processing of the minigenes. Early elongation complexes were formed during a pulse-labeling step with each of the three minigene templates. The early elongation complexes were washed with a high salt concentration and Sarkosyl and chased in the absence (−) or presence (+) of extract for 10 min. A, arrested transcript; arrow, processed transcript.

