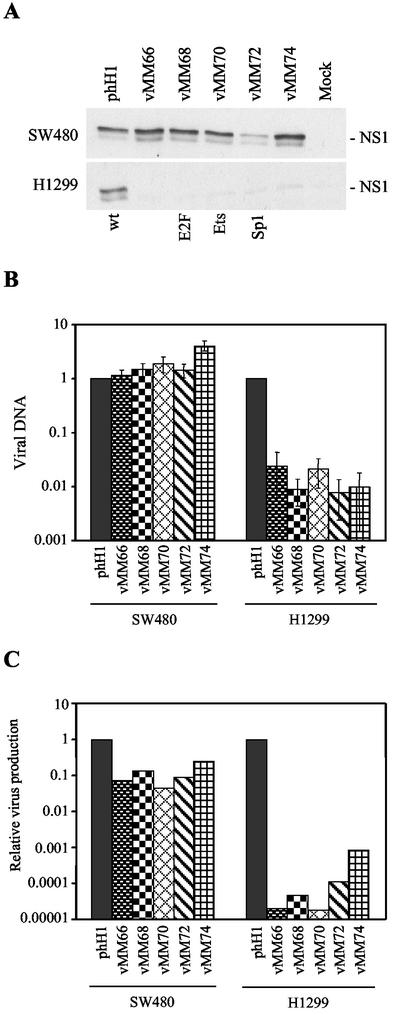
FIG.4.
Tcf virus infection of SW480 and H1299 cells. (A) Western blots done at 24 h postinfection showing expression of NS1 in the colon cancer cell line SW480 (upper panel) and the lung cancer cell line H1299 (lower panel). (B) Viral DNA content at 24 h postinfection of SW480 and H1299 cells, as determined by quantitative PCR. The values are normalized to the parental phH1 results. (C) Burst assays in SW480 and H1299 cells measuring virus production at 48 h postinfection. The values are normalized to the phH1 results.

