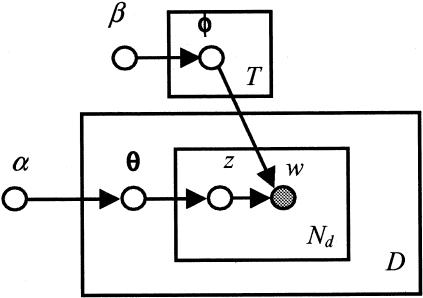
Figure 2.
The directed acyclic graphical representation of the LDA model. Each node represents a variable, and a shaded node indicates an observed variable. Each rectangle plate represents a replica of the data structure. The variables D and Nd at the bottom right of plate indicate the number of the replicates of the structure.

