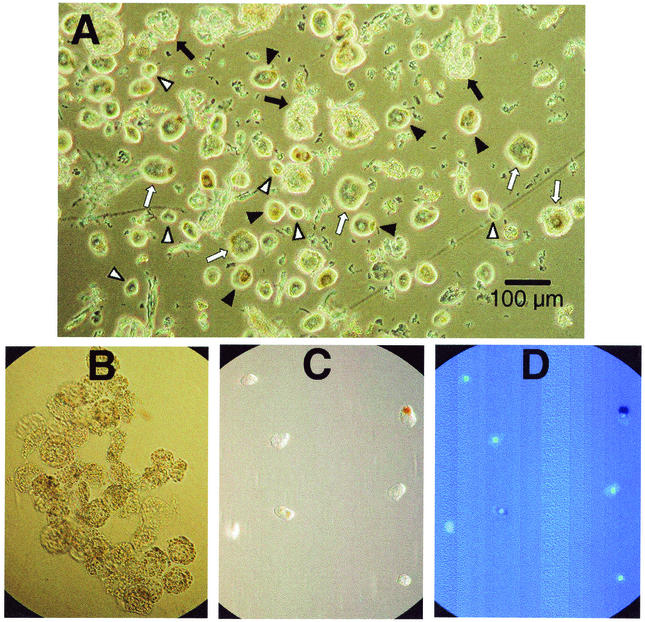
FIG. 1.
Photomicrographs of neurons and satellite cells. (A) Minced ganglia after filtration and sedimentation, showing small (▿), medium (▾), and large (⇒) neurons as well as clumps of satellite cells (➞). Magnification, ×20 (Hoffman optics). (B) Clumps of isolated satellite cells. Magnification, ×20 (Hoffman optics). (C) Single neurons viewed with phase contrast. Magnification, ×20. (D) Same field as panel C stained with DAPI, demonstrating that neurons are free of attached satellite cells. Magnification, ×20 (fluorescence).

