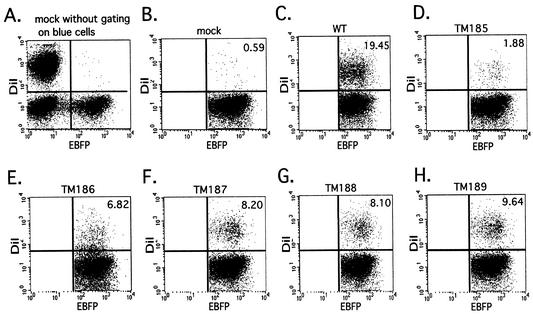
FIG. 3.
Results of flow cytometric analysis of fusion efficiencies of SIV TM mutants. COS-1 cells were transfected as described in the legend to Fig. 2 to express both EBFP and wild-type (WT) or mutant Env proteins or EBFP alone (mock). Target MAGI-CCR5 cells were labeled with FAST-DiI, coincubated with effector cells for 1.5 h at 37°C, and then subjected to flow cytometric analysis. Flow cytometry panels depict the separation of different populations of cells; the EBFP-DiI-double-positive population comprises cells with fused membranes. The percentages of fused blue cells were calculated to quantitate fusion efficiencies of different mutants and are indicated on panels B to H. In panel A, all cell populations (in the absence of Env expression) are represented without gating of blue cells: nonfluorescent (non-EBFP-expressing) COS-1 are localized to the lower left quadrant, EBFP-positive (blue) COS-1 are in the lower right, and FAST-DiI-labeled MAGI-CCR5 are in the upper left. For simplicity of presentation, panel B represents the population after gating of blue cells. EBFP-FAST-DiI-double-positive cells are located in the upper right quadrant. Panels C through H show results of analyses of COS-1 effector cells and MAGI-CCR5 target cells expressing wild-type and mutant Env.

