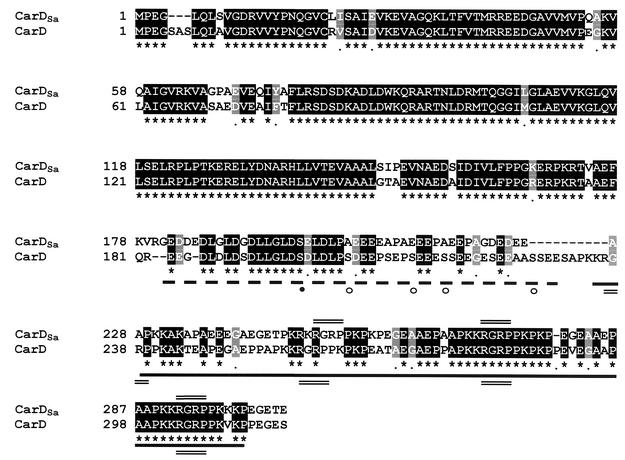
FIG. 2.
Sequence alignment of proteins CarDSa and CarD. Identical residues in CarDSa (top line) and CarD (second line) are shaded in black and indicated by an asterisk in the bottom line, while similar residues are shaded gray. The thick dashed line indicates the highly acidic region, and the thick solid line indicates the flanking basic AT hook region. The RGRP AT hooks (three in CarDSa and four in CarD) are marked by double lines. CKII target sites predicted in the acidic region are indicated by circles, with the filled one being the only such site in CarDSa that is also present in CarD.

