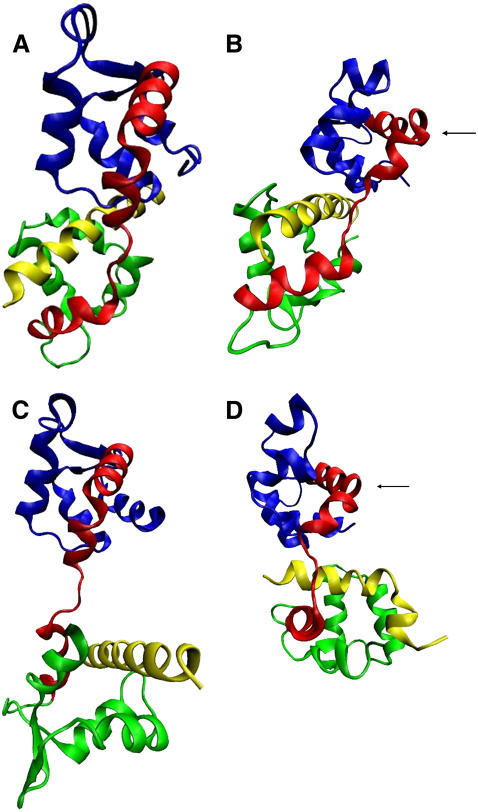
FIGURE 1.
Cartoon diagrams of the crystal and the simulated structures of the Mlc1p protein when it binds the IQ2 peptide (PDB 1M45), and the IQ4 peptide (PDB 1M46). The N-lobe (residues 1–59), the interdomain (residues 60–92), the C-lobe (residues (93–148), and the IQ peptides are shown in blue, red, green, and yellow, respectively. Both crystal structures, and both simulated solution structures, are presented with the same orientation, where the N-lobes are structurally aligned. (A) The crystal structure of the Mlc1p-IQ2 complex; (B) the simulated structure of the Mlc1p-IQ2 complex after 12-ns simulation; (C) the crystal structure of the Mlc1p-IQ4 complex; and (D) the simulated structure of the Mlc1p-IQ4 complex after 12-ns simulation. The black arrows in frames B and D mark the kink of helix D.

