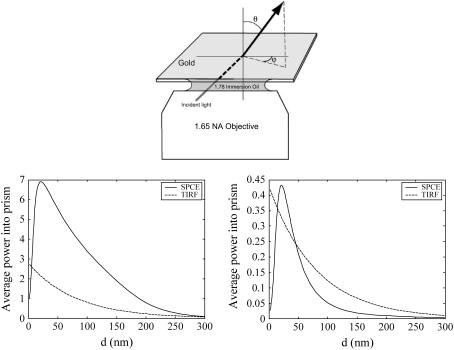
FIGURE 6.
(Top) Definition of angles. (Bottom) Calculated power flow to the objective in the SPCE experiments for (left) θ = 0°, i.e., p-orientation and (right) θ = 90°, i.e., s-orientation of the transition moment. The time between excitation of the fluorophores is assumed much longer than the emission time. Note that the power of the p-polarization is ∼10 times greater than that of s-polarization. Gold layer of 48 nm, excitation wavelength = 633 nm, at maximum field (57.86°), emission at 670 nm (solid line, SPCE; broken line, TIRF). The strong dissipation of energy into the metal layer for short distances lowers the power in SPCE but not in TIRF.

