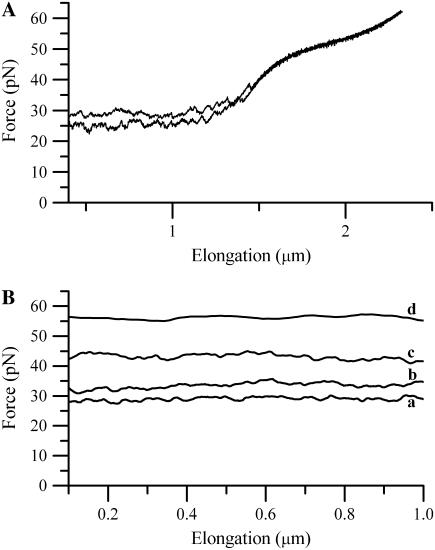
FIGURE 3.
(A) A force-versus-elongation response of the last part of region II and the first part of region III from an individual E. coli P pilus for two dissimilar elongation velocities: lower curve, 0.2 μm/s; and upper curve, 0.8 μm/s. (B) The dynamic response of the unfolding of the quaternary structure of the PapA rod in region II for four different elongation speeds: a, 0.1 μm/s; b, 0.75 μm/s; c, 5.7 μm/s; and d, 42.7 μm/s. The data in B have been subjected to a moving-average filtering for clarity.

