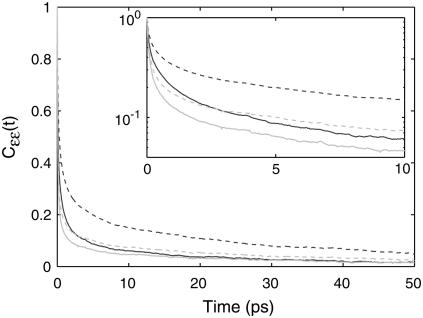
FIGURE 4.
The normalized site-energy fluctuation correlation function (solid line), calculated with the Keiderling 5P (dark) and Jansen 4F (light) models (a representative potential and field site-energy model, respectively) are shown, in addition to the contribution from water (dashed line) for both models.

