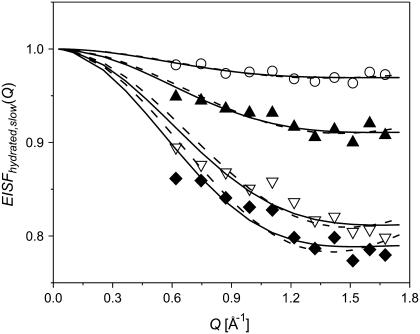
FIGURE 10.
EISFhydrated,slow(Q) of hydrated samples (for definition, see text, Eq. 8) at h ∼ 0.18 (○); 0.30 (▴); 0.50 (∇); 0.80 (♦) at T = 295 K. The dashed lines present fit to the two-site (Eq. 9) and three-site (Eq. 4) jump models (fits are indistinguishable at this Q-range) and the solid lines present fits to freely diffusive motions in a sphere model (Eq. 10).

