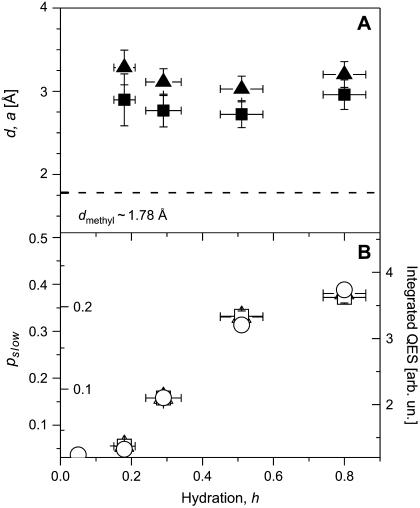
FIGURE 11.
(A) Amplitude of motions (jump distance d and radius of sphere a) involved in slow relaxation process at different hydration levels obtained from the fit to two-site jump model (▴) and to freely diffusive motions in a sphere model (▪). The dashed line shows the jump distance expected for methyl groups. (B) Variation of mobile fraction of hydrogen atoms involved in the slow relaxation process, Pslow, with hydration obtained from the fit to two-site jump model (▴, outside labels) and to freely diffusive motions in a sphere model (□, inside labels). QES intensity integrated in the frequency range from 2 to 8 GHz (○) is presented for a comparison.

