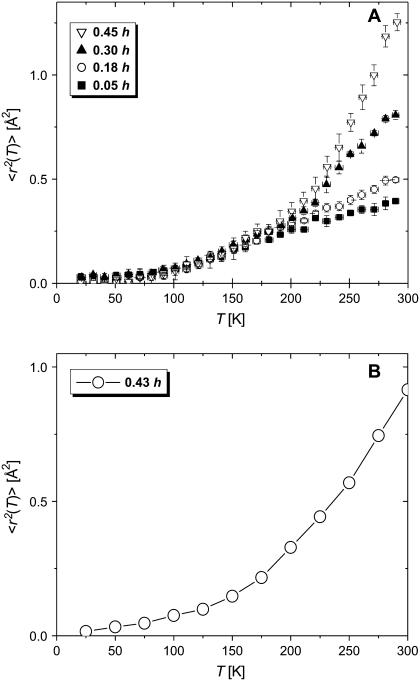
FIGURE 2.
Temperature variations of mean-squared atomic displacement, 〈r2(T)〉. (A) Experimental data at different hydration levels: 0.05 (dry), 0.18, 0.30, and 0.45 h. Crystallization of D2O prevented accurate measurements of 〈r2(T)〉 in samples at h > 0.45. (B) Simulations for wet lysozyme (0.43 h).

