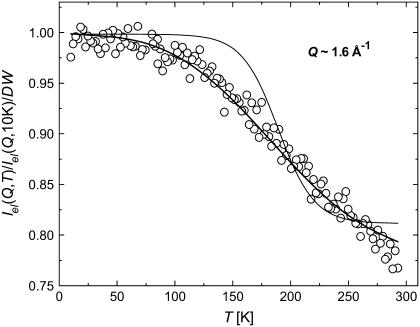
FIGURE 5.
Temperature variations of elastic intensity, Iel(Q,T), in dry sample (0.05 h) corrected for the Debye-Waller factor (○). Solid lines represent the results of the fit using Eq. 2 with a single barrier E ∼ 16 kJ/mol (thin line) and a Gaussian distribution of the energy barriers with E0 ∼ 16.6 kJ/mol and ΔE ∼ 5.8 kJ/mol (thick line) for the methyl-group rotation.

