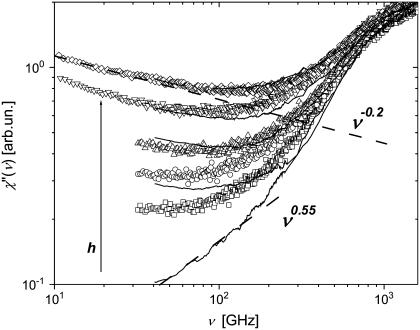
FIGURE 8.
Neutron scattering susceptibility, χ″TOF(ν) (symbols), and light-scattering susceptibility, χ″LS(ν) (solid lines), of samples at different hydrations (neutron-scattering measurements: h ∼0.05 (dry), 0.18, 0.30, 0.50, and 0.80; light-scattering measurements: h ∼0.03 (dry), 0.20, 0.35, 0.50, and 0.85) at T = 295 K. The dashed lines show the slope of high-frequency tail of slow relaxation process (χ″(ν) ∝ ν −0.2) and the slope of low-frequency tail of the fast relaxation process (χ″(ν) ∝ ν0.55).

