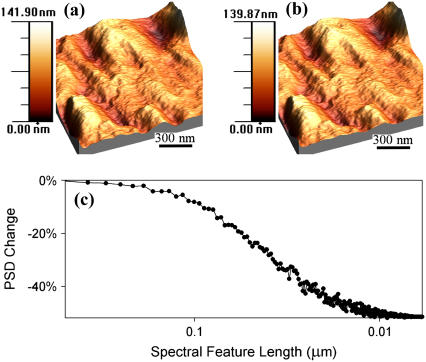
FIGURE 3.
Topographic image of a blood cell (a), the corresponding measured topography in the presence of a DEP force (b) (20 Vpp, 1.5 MHz), and the difference in power spectral density (PSD) for the two images (c). The horizontal plane of the image is 1.5 μm × 1.5 μm and the vertical ranges of both images were 140 nm. The high-resolution images of blood cells acquired in (a) and (b) were qualitatively similar, but significant loss in PSD in the high spatial frequency regime was observed in topographic images of erythrocytes acquired in the presence versus absence of an AC electric field.

