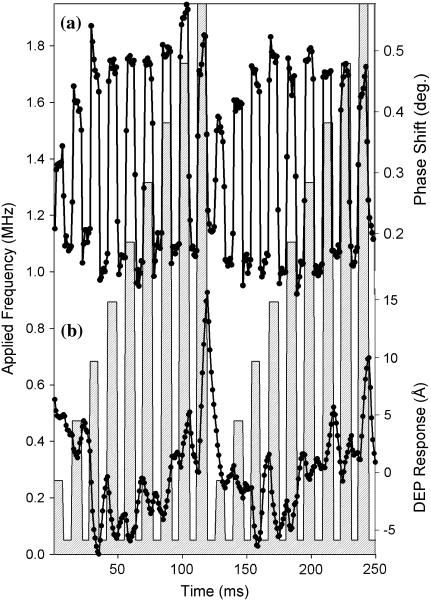
FIGURE 5.
Frequency-dependent DEP of a single erythrocyte in water, in which the frequency of a 20-Vpp applied waveform was modulated between a reference frequency of 50 kHz and a test frequency varied from 250 kHz to 1950 kHz (indicated by the vertical bars). The measured phase (a) and height (b) responses are shown as solid circles connected by straight lines (averages of ∼250 measurements).

