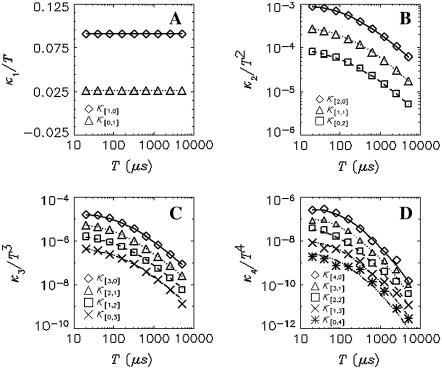
FIGURE 1.
Dual-color cumulant analysis of a Rhodamine 6G solution. The data were taken with a sampling time of 20 μs and a total acquisition time of 130 s. Each cumulant  is divided by Tr, where r = i + j is the order of the cumulant. The cumulants with the same order are plotted in the same panel. The best fit to a single species model is shown as lines. The fit determined λA = 34,000 cpsm and λB = 9600 cpsm, a diffusion time of τd = 44 μs, and an occupation number of N = 2.7 with a reduced χ2 value of 0.85.

