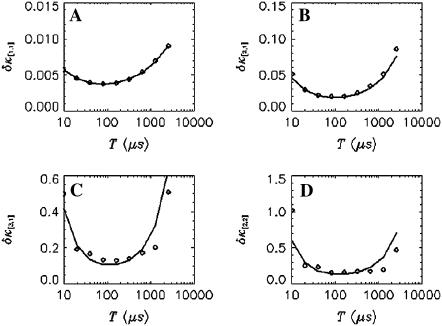
FIGURE 2.
The relative error  of factorial cumulants determined by the moments-of-moments analysis as a function of binning time. The diamonds represent the relative error calculated from the experimental data. We also calculated theoretical cumulants from the fit parameters and determine the relative error using the moments-of-moments variance (solid lines). The data were taken with a sampling time of 10 μs and a total data acquisition time of 130 s.

