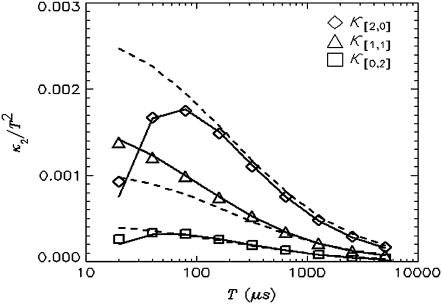
FIGURE 3.
The dead-time effect on the second factorial cumulant. A concentrated Alexa 488 solution was measured with a sampling time of 10 μs for 60 s. The average intensity measured is 817 kHz in channel A and 324 kHz in Channel B. The normalized second-order factorial cumulants  (with i + j = 2) are plotted as a function of sampling time T. The dashed lines represent a fit to the data with the ideal model. Without dead-time effects, κ[i,j]/T2 should decay monotonically. The dead-time strongly influences the cumulant in the short sampling time limit, making the experimental cumulants smaller than the ideal ones. The fit to the nonideal model is shown as solid lines.

