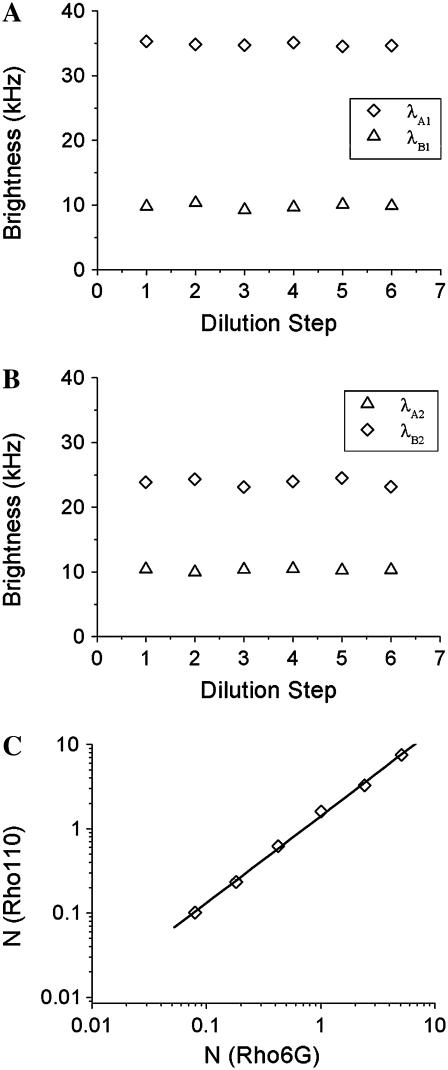
FIGURE 6.
Dual-color TIFCA analysis of a binary dye mixture of Rhodamine 6G and Rhodamine 110. The mixture was repeatedly diluted and measured for 130 s after each dilution. Each data set is fit to a two-species model. The brightness recovered from the fit is plotted in panels A and B for Rhodamine 6G and Rhodamine 110, respectively. The brightness in channel A is shown as diamonds, while the brightness in channel B is graphed as triangles. The number of molecules is plotted in panel C. The numbers of molecules of both species are linearly related as expected, because the concentration ratio remains constant during dilution. A fit of the data to a straight line recovers a slope of 1.45, which reflects the concentration ratio of the dyes in the mixtures.

