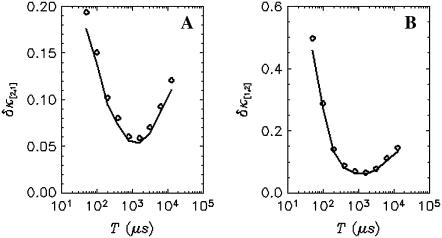
FIGURE 8.
The relative error of third-order cumulants measured for EGFP in a living cell. The data is taken with sampling time of 50 μs and a total acquisition time of 330 s. The relative errors of  (A) and
  (B) are plotted as a function of binning time. The symbols are experimental data and the solid lines represent the theoretical curve calculated from the parameters recovered by the fit.

