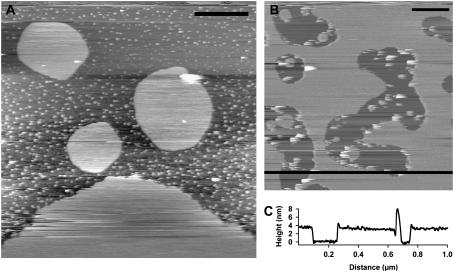
FIGURE 4.
(A) DOPC lipid sample prepared using 100 μg/ml concentration showing large lipid islands directly on the mica surface, in addition to numerous small vesicles. Scale bar, 0.5 μm. (B) Lipid sample prepared using 250 μg/ml concentration showing greater surface coverage and defects. Scale bar, 0.2 μm. (C) Height cross-section taken across black line in panel B indicating a bilayer height of ≈3.8 nm.

