
Figure 1.
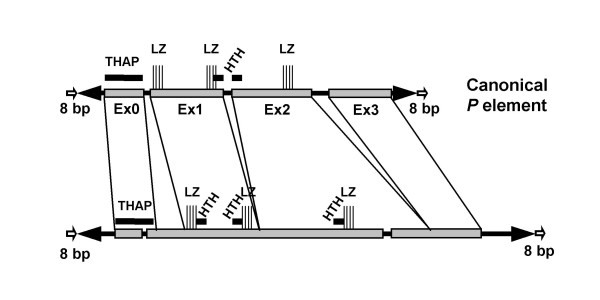
Diagram showing the predicted structure of the P element family of A.gambiae compared to the structure of the canonical P element of D. melanogaster. Black triangles represent the TIRs, white arrows represent the TDS, Gray rectangles represent the exons. Protein motifs: THAP: DNA binding domain, LZ: Leucine zipper, HTH: helix-turn-helix