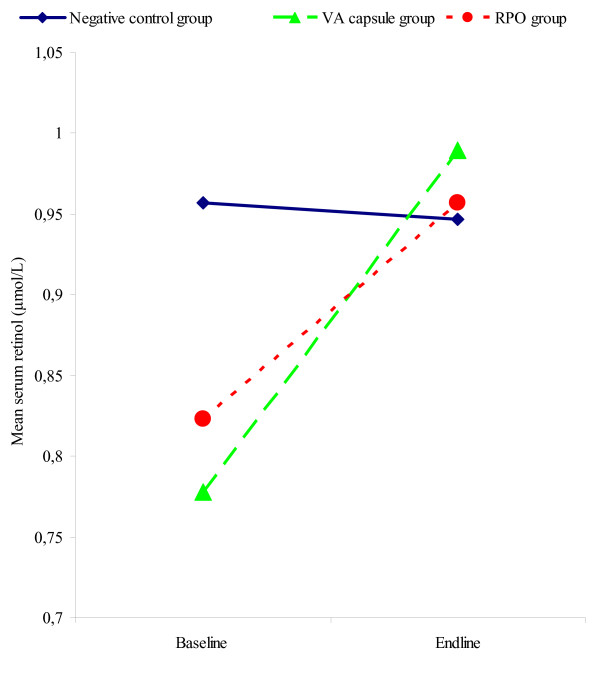
Figure 2.
Mean serum retinol changes according to treatment group, Bogandé. The continuous and blue line represents the negative control group of 8 schools, where the pupils received only the regular school lunch during the 2003–04 school year. The dashed green line represents the positive control group of 8 schools, where the pupils received a single VA capsule (60 mg) at the end of the 2003–4 school year. The dashed red line represents the last 8 schools where fortified RPO meals were served to pupils from November 2003 until June 2004.

