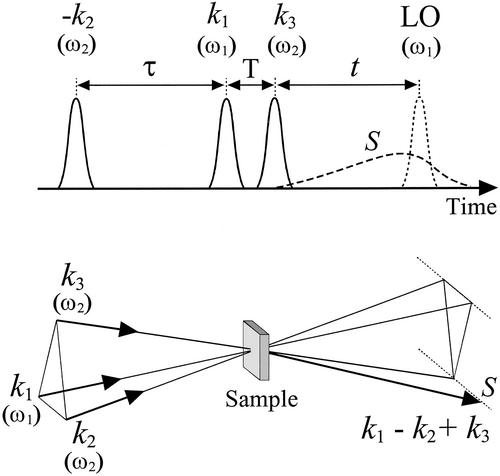
Figure 1.
(Upper) Time sequence of the dual-frequency three-pulse photon-echo experiment. S (dashed line) is a typical signal envelope. LO denotes the local oscillator pulse. (Lower) The spatial arrangement of the three beams interacting with the sample. The pulse intervals used in the text are indicated. The signal envelope is observed in the k1 − k2 + k3 direction.

