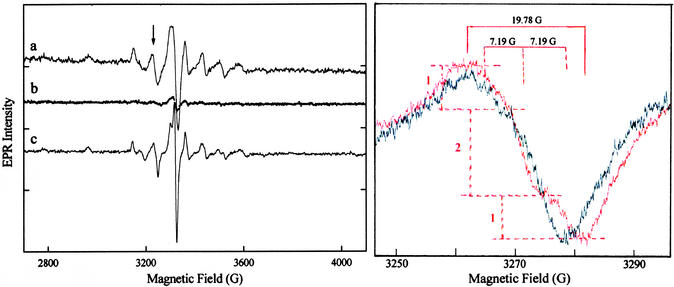
Figure 2.
Comparison of first-derivative EPR absorption spectra of VO2+. (Left) a, dUTPase–VO2+–dUDP complex; b, identical conditions to those in a but after addition at 5°C of a 10-fold excess of Mg2+; and c, dUTPase–(VO2+-chelate)–dUDP complex. (Right) An expanded comparison of the −3/2⊥ feature of the EPR spectrum (indicated by an arrow in Left) of the VO(acac)2–dUDP mixture in the absence (black spectrum) and presence (red spectrum) of dUTPase. The intensity ratios of 1:2:1, the three hyperfine lines with ap = 7.19 G, and the total line width of 19.78 G are also indicated in red. Molar ratios of enzyme–VO2+–dUDP or of enzyme–VO(acac)2–dUDP were 1.25:1:1, respectively, at a dUTPase concentration of 1.35 × 10⁻³ M buffered to pH 7 in 0.1 M NaCl with 0.01 M Hepes.

