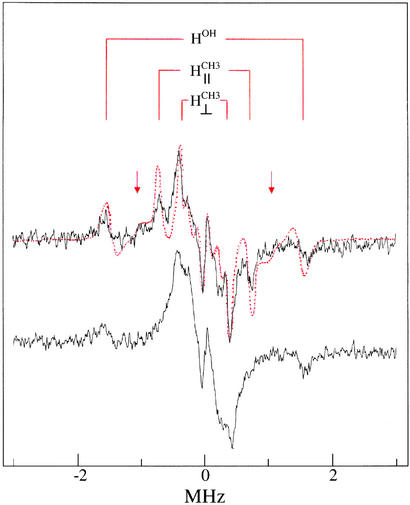
Figure 3.
Comparison of first-derivative ENDOR spectra of the ternary dUTPase–(VO2+-chelate)–dUDP complex resulting from addition of dUTPase, VO(acac)2, and dUDP in 1.25:1:1 molar ratio as in spectrum c of Fig. 2. (Upper) ENDOR (black) spectrum of the dUTPase–(VO2+-chelate)–dUDP complex. The red dots represent the ENDOR spectrum of VO(acac)2 in the presence of only dUDP (added in 1:1 stoichiometry). It is seen that the resonance features of the methyl groups of VO(acac)2 free in solution (30), labeled H and H
and H , directly overlap with the prominent features of the spectrum of the ternary enzyme complex. The weaker resonance features belonging to the bridge hydrogens of the acetylcacetonate ligand are identified by arrows. Also, the A⊥ component of a solvent hydroxyl proton, labeled HOH, that is observed for H2O coordinated in the axial position trans to the vanadyl oxygen (15) is shown. (Lower) Proton ENDOR spectrum of the ternary dUTPase–(VO2+-chelate)–dUDP complex formed with VO(d7-acac)2. The loss of the prominent methyl proton resonances seen in Upper confirms their chemical origin. The central Larmor frequency region shows only broad overlapping resonance features of protein residues.

