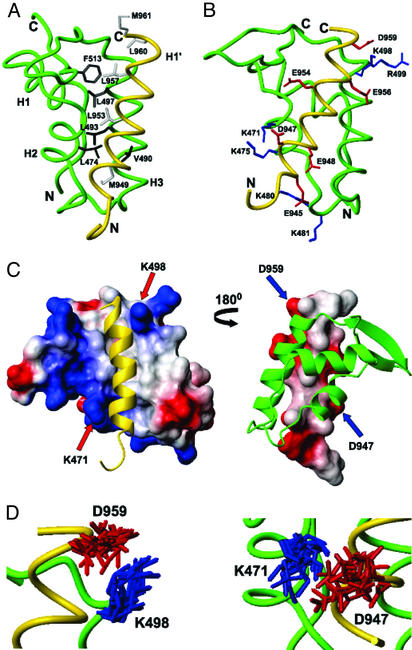
Figure 3.
Interactions between cterRAP74 and cterFCP. (A) Backbone trace of the cterRAP74 (green)/cterFCP (gold) complex highlighting the hydrophobic amino acids of cterRAP74 (dark gray) and cterFCP (pale gray) at the interface. (B) Backbone trace of the cterRAP74/cterFCP complex (green/gold) highlighting the basic amino acids of cterRAP74 (blue), and the acidic amino acids of cterFCP (red) at the interface. (C) Molecular surface representation of cterRAP74-(451–517) (Left) and cterFCP-(941–961) (Right) from the cterRAP74/cterFCP complex. In the representation of the cterRAP74 surface, cterFCP (yellow ribbon) fits within a hydrophobic groove on the surface of cterRAP74. Areas of positive (blue) and negative (red) charge are highlighted and the two lysines residues involved in formation of the well defined salt bridges are labeled (K471 and K498). In the representation of the cterFCP surface (Right), the hydrophobic side chains of cterFCP are directly inserted into the hydrophobic groove of cterRAP74 (green ribbon). Areas of negative charge (red) are highlighted and the two aspartic acid residues involved in formation of the salt bridges are labeled (D947 and D959). (D) Overlay of the 20 lowest-energy NMR structures, highlighting the lysine and aspartic acid side chains in the two salt bridges (K498/D959 and K471/D947).

