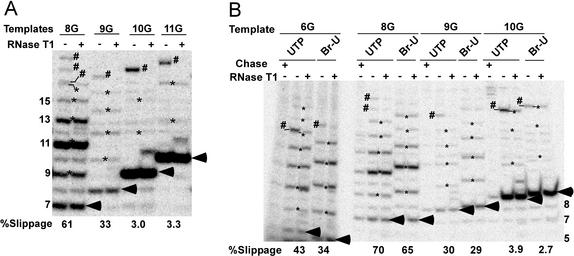
Figure 3.
(A) TCs initiating with a dinucleotide acquire most of their resistance to transcript slippage on synthesis of a 9-nt transcript. Transcription was carried out on the indicated templates (see Fig. 1) with dinucleotide primers in the absence of GTP as described in Experimental Procedures. RNAs in the indicated lanes were digested with RNase T1. It should be noted that, among the templates we tested, determining the extent of slippage was most problematic with 10G and 11G. All of the T1-resistant bands were scored as slippage products for these templates, although some of these bands do not seem to be the expected length for slippage products. We believe that these anomalous-length RNAs resulted from slippage followed by transcript cleavage from low levels of SII in the reactions, although we have not explored this point further. Pol II transcription complexes may vary considerably in their sensitivity to SII-mediated cleavage (see ref. 18). (B) Incorporation of 5Br-UTP instead of UTP does not significantly alter the transcript slippage activity of halted elongation complexes. Transcription of the indicated templates was performed as in Figs. 2 and 3A except that 5Br-UTP was substituted for UTP in the indicated reactions. An equal aliquot of each reaction mixture was chased with 200 μM of all four NTPs at 30°C for 5 min. Run-off transcripts are not shown. For both panels, arrowheads designate the expected G-stop (nonslipped) transcripts. Slippage and leakthrough transcripts are marked by asterisks and pound signs, respectively. The percentage slippage is the fraction of complexes that underwent at least one round of transcript slippage. Lengths of selected RNAs are given in the margin of the gels.

