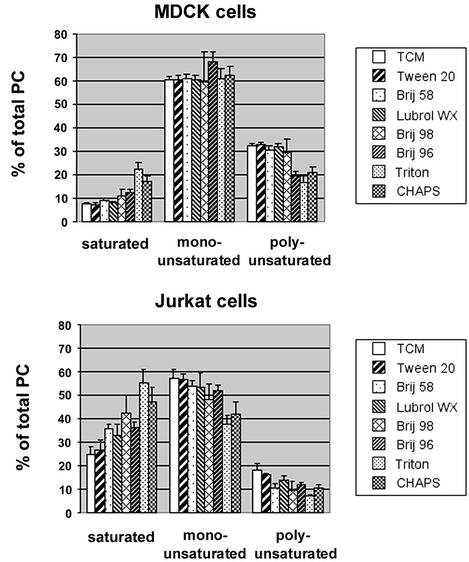
Figure 5.
Saturation profile of PCs in DRMs from MDCK and Jurkat cells. TCMs and DRMs were obtained as before, lipids were extracted, and PC was analyzed by mass spectrometry. Percent fractions of each PC species were determined and grouped into saturated (30:0, 31:0, 32:0, 34:0), monounsaturated (31:1, 32:1, 33:1, 34:1, 36:1), and polyunsaturated (32:2, 33:2, 34:2, 35:2, 36:3, 36:2, 38:3) PC species (in x:y, x indicates the total number of carbon atoms of the fatty acid side chains; y indicates the number of double bonds). Error bars represent standard deviations of three measurements of the same samples.

