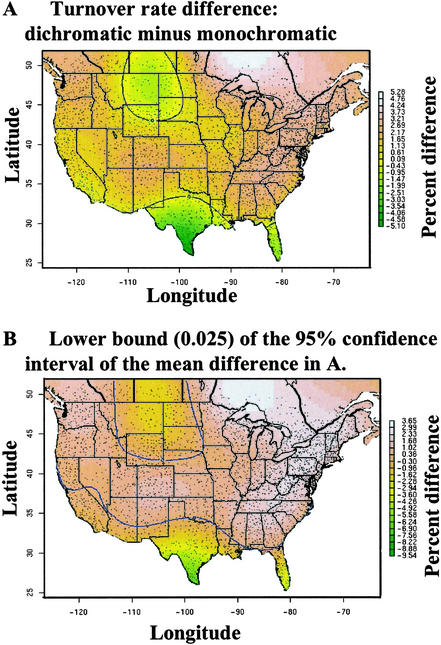
Figure 2.
The estimated mean difference between dichromatic and monochromatic turnover rates (A) and the lower 95% confidence interval around the mean (B). The area in which this difference is <0 is delineated by the blue contour line and is green in color. The small black dots represent North American BBS routes.

