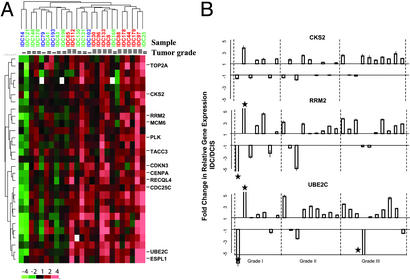
Figure 4.
Genes with increased expression in IDC relative to DCIS. (A) Cluster of 29 genes showing consistent up-regulation in IDC. Expression values are expressed as log2-ratios of expression in IDC to that in patient-matched DCIS. Color scheme is shown at bottom left; see Fig. 2A for sample color designations. The original data are in Table 5. (B) Confirmation by QRT-PCR of increased expression in IDC for CKS2, RRM2, and UBE2C. Fold changes from DCIS to IDC and associated standard errors are plotted. Data shown are averages of triplicate QRT-PCR measurements. Values outside the scale in the y axis are marked by a star. The patient case numbers from left to right are: 14, 25, 79, 102, 173, 180, and 193 for grade I; 41, 43, 121, 130, 131, 148, 169, 170, and 198 for grade II; and 8, 30, 44, 65, 88, 96, 112, 133, 178, and 179 for grade III.

