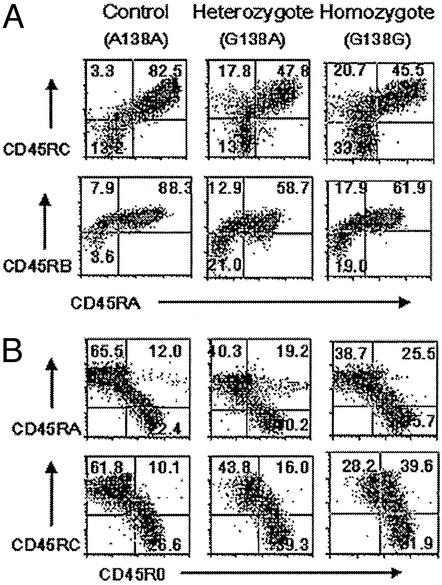
Figure 2.
Expression of CD45 isoforms in human peripheral T cells. (A) PBMC were stained with isoform-specific antibodies against CD45RA and CD45RB or CD45RA and CD45RC together with anti-CD3. Analysis was performed on gated CD3+ cells. A138G individuals show a decrease in the proportion of cells expressing both CD45RA and CD45RC or CD45RA and CD45RB isoforms. (B) Expression of CD45R0, CD45RA, and CD45RC on CD3 cells from A138G and control individuals. PBMC were stained with anti-CD3 together with isoform-specific CD45R0 and CD45RA or CD45R0 and CD45RC antibodies. In the G138G variant, an increase in the proportion of CD45R0+ cells is seen. Examples are representative of similar analyses of four A138G homozygous, heterozygous, and control individuals. The ages of the individuals in the flow cytometric profiles shown are 31 (common variant control A138A), 35 (A138G heterozygote), and 29 (G138G homozygote) years.

