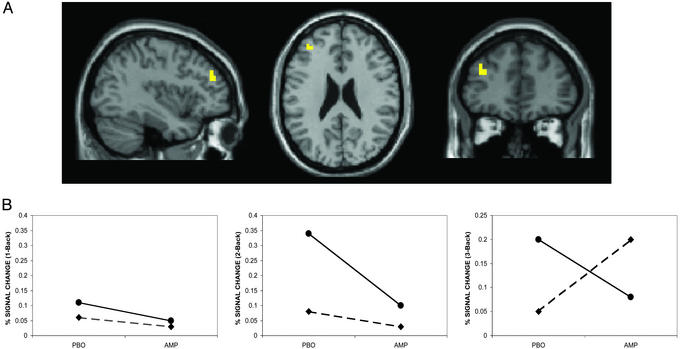
Figure 1.
(A) Representative sagittal, axial, and coronal slices from a group analysis showing locales of a drug × COMT genotype interaction in the left PFC (Brodmann's area 9/46, Talaraich coordinates −38, 45, and 24, Z score >2.3, P < 0.01, corrected) during the WM task (see Fig. 5, which is published as supporting information on the PNAS web site). (B) Percent change in BOLD signal in the left PFC during the N-back relative to the control task on AMP and PBO conditions. The percent change in BOLD signal was calculated post hoc by using the mean signal intensity values extracted from the cluster of voxels that showed a significant drug × COMT genotype interaction (see text for details). Of note, similar to the findings of Egan et al. (19), there is a main effect of genotype at baseline (PBO condition), as val/val (●) individuals are less efficient than met/met individuals (♦) at all levels of task difficulty. Other PFC areas that were significant on this interaction analysis include Brodmann's area 6 (8, −1, and 55, Z score >3, P < 0.001) and Brodmann's area 44 (−49, 11, and 10, Z score >2, P < 0.02). There were no areas outside the PFC that showed a significant drug × genotype interaction.

