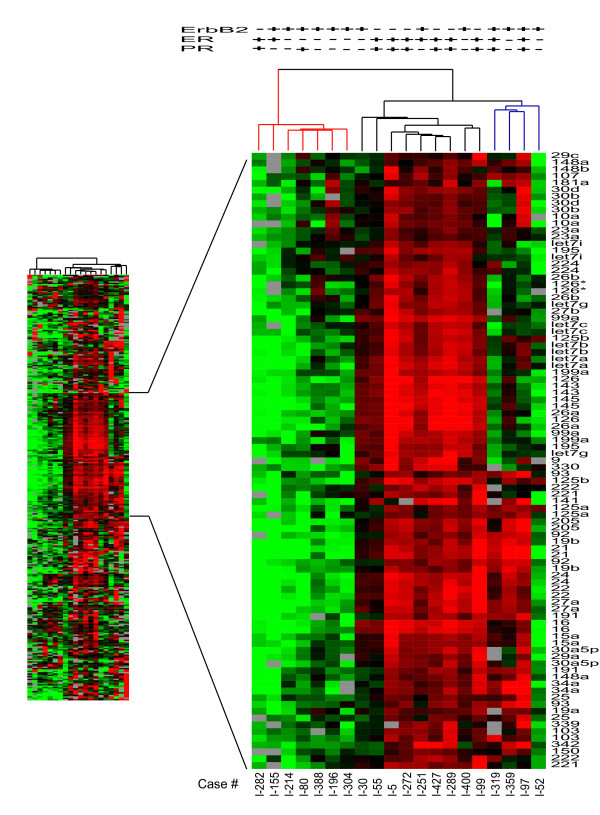
Figure 5.
Unsupervised hierarchical cluster of breast tumor samples. The tree was generated by cluster analysis of all 20 breast tumor tissue samples and displays the clinical pathologic features for ErbB2, estrogen receptor (ER), progesterone receptor (PR), and p53 (w = wild type, m = mutant). Cluster analysis revealed three distinct branches of the dendrogram. Duplicate spots for each probe are displayed and were not averaged for this analysis to demonstrate the consistency of expression values between duplicate spots. The probe sequence for mir-126* is distinctively different from mir-126.

