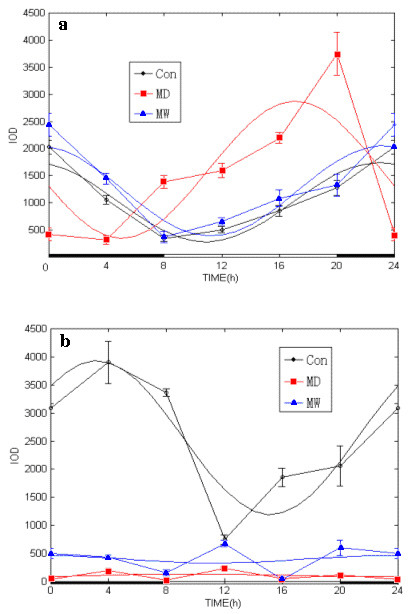
Figure 4.

Circadian variation of mPER1 protein expressed in the brains and kidneys of Con, MD and MW mice. The integral optical density (IOD) of mPER1 immunoreactivity, an index of mPER1 protein expression level, was analyzed by image pro plus software. Time point means and SE of protein expression are shown along the 24-hour time scale. The best fitting cosine curves are shown in these panels. a: The mPER1 protein expression in brains was increased and acrophase of circadian rhythm was advanced in the MD mice as compared with Con and MW mice, statistically tested by the cosinor parameter test designed by Bingham et al. [18]. b: The mPER1 protein expression in the kidneys was severely inhibited and the circadian rhythm of mPER1 protein expression in the MD and MW mice was obliterated by morphine administration. Con mice exhibited robust rhythmicity in mPER1 expression.
