
Figure 4.
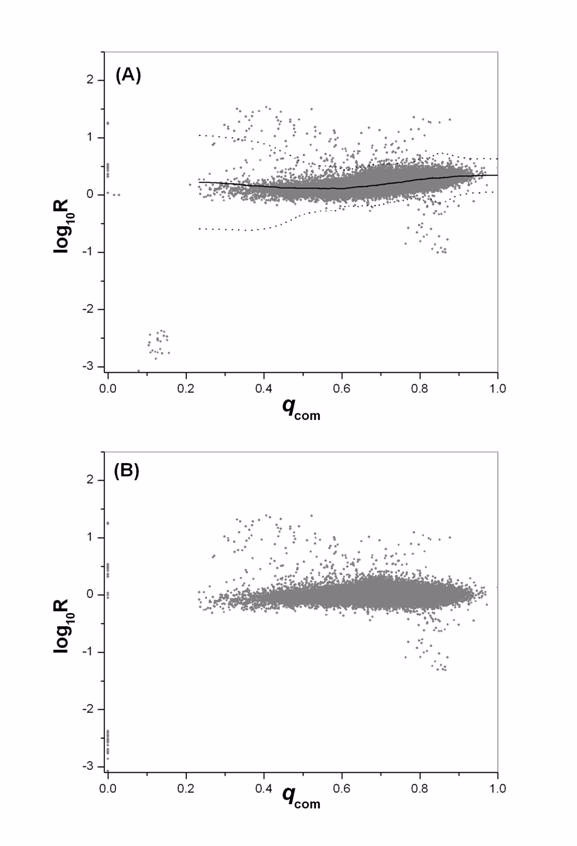
Quality dependent data filtering and normalization. Data are from one hybridization between day 65 and day 40 DP rats of experiment 1. (A) Log ratio distribution before normalization is plotted against qcom. Spots with qcom < 0.20 exhibit significantly increased variability, and will be reset to qcom = 0. Normalization will be performed for all spots with qcom > 0.20. Also shown are the normalization factor (solid line) and the local 3 SD from mean (dotted line). (B) The same data after filtering and normalization.