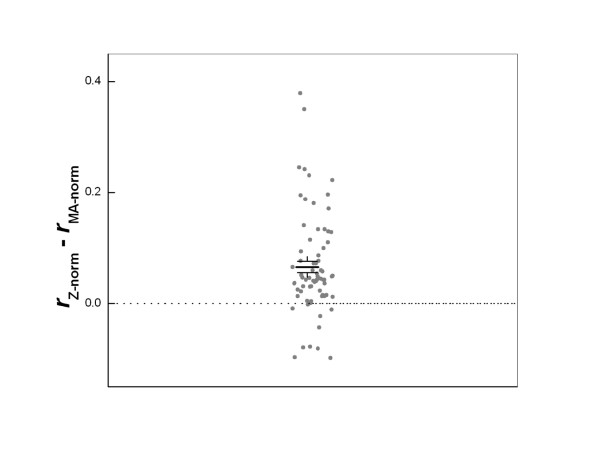
Figure 5.

Comparison of Z-norm and MA-norm methods. Data shown are the differences in the correlation coefficients r between all 74 direct replicate pairs from the four data sets using the two normalization approaches. X-axis values are random numbers assigned to each data point in order to separate them. For most cases, Z-norm leads to better replicate correlations. The solid lines show the mean difference and the standard error of the mean. The difference is significant with p < 0.0001.
