
Figure 6.
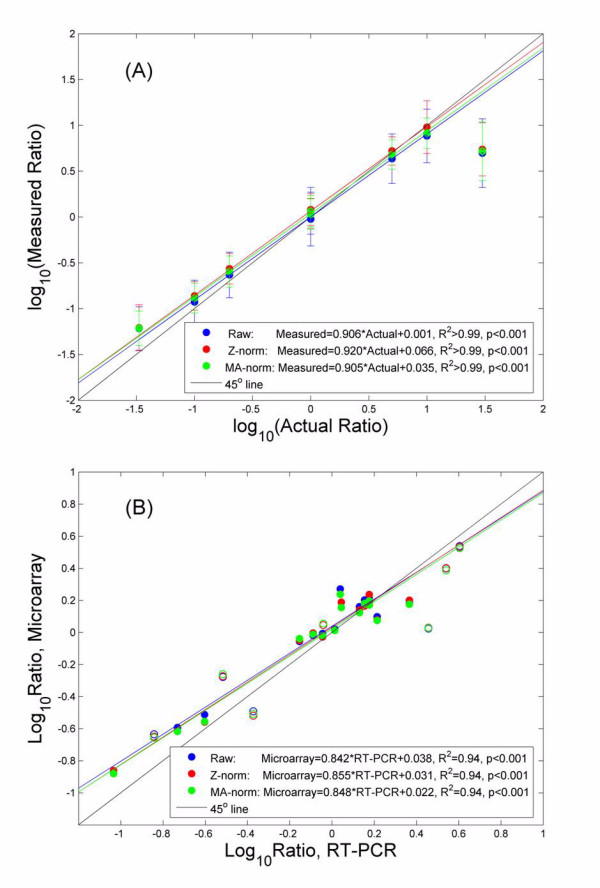
Accuracy of gene expression measurements by our microarray platform. (A) The measured ratio is compared with the actual ratio, using raw ratio measurements (Raw), ratio after our normalization pipeline (Z-norm), and ratio after MA-LOWESS normalization (MA-norm). Good agreements between measured and actual are observed. The last data point is excluded from the linear regressions. (B) Measurements by microarray are compared with those by RT-PCR in the rat liver experiment. Again a highly linear relationship is observed, with very small compression in the microarray measurements. Our method exhibits a moderate, insignificant improvement over MA-norm. Seven genes with poor quality microarray data (open circles) were excluded from the linear regression.