
Figure 3.
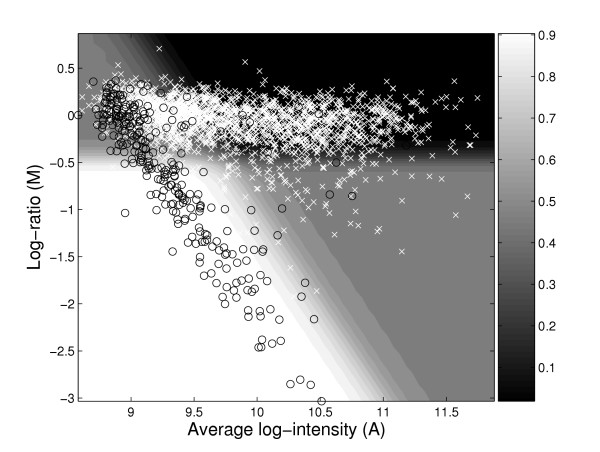
Heatplot of ROTMIX in the MA-plane. ROTMIX-classification in the data set COL vs. N315 in the MA-plane. Divergent and present genes are marked by black circles and white crosses, respectively. The underlying shading illustrates how the ROTMIX-score varies over the plane, numerical values given by the gray-scale bar at the right. The ROTMIX score is an average of two posterior probabilities using plain and rotated data, for details refer to equation 6 in the Methods part.