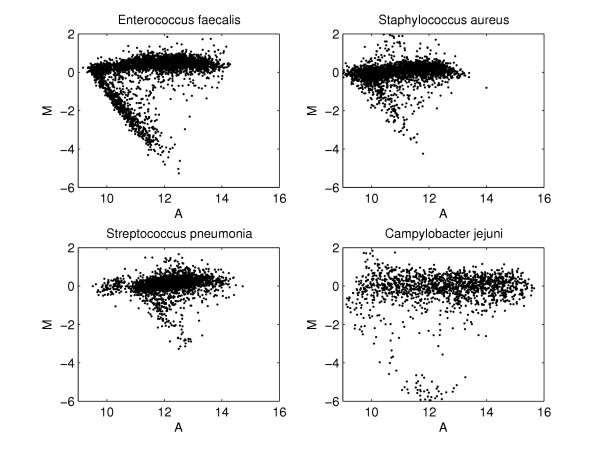
Figure 6.

MA-plots for different aCGH experiments. Plots of log-ratio (M) against average log-intensity (A) for four aCGH data sets from four different bacteria. The characteristic V-shaped pattern is most clearly visible in the upper left panel, but is also more or less present in the other MA-plots.
