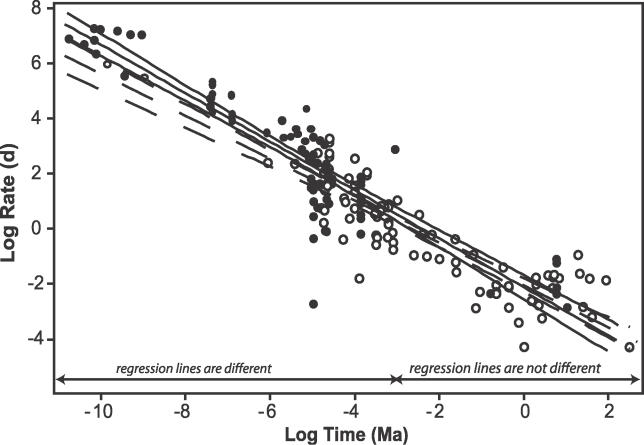
Figure 2. Relation between Evolutionary Rates (Mean Values, darwins) and the Time Interval (Million Years) over which They Were Calculated.
Filled circles: islands, open circles: mainland; the regression line for islands (solid line) is above the line for the mainland (dotted line). The 95% confidence intervals of the two regression lines do not overlap between the two groups at the smallest time intervals. The difference in elevation (i.e., the rate difference) between the two lines is statistically significant below 0.05 million years.

